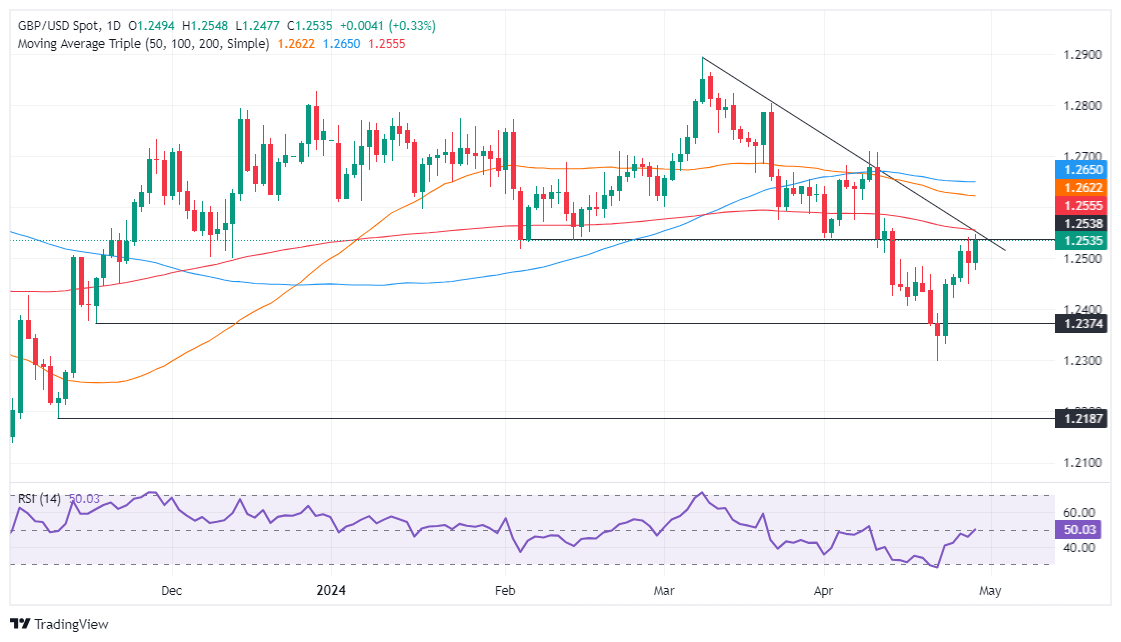
GBP/USD rises, rebounding from 1.2474 amid rumors impacting the US Dollar.
- Currently, GBP/USD tests the 200-day moving average at 1.2555, showing a neutral to slight bearish outlook.
- Breaking above the 200-DMA may target 1.2600, with potential further gains to 1.2621 and 1.2645.
- Failure to exceeded the 200-DMA could prompt a retest of the 1.2500 support.
The Pound Sterling advanced sharply against the US Dollar in early trading during Monday’s North American session after hitting a daily low of 1.2474. Rumors of an intervention by Japanese authorities to propel the Japanese Yen (JPY) weighed on the Greenback, which is tumbling against most G8 FX currencies. Therefore, the GBP/USD trades at 1.2534, gaining 0.36%.
GBP/USD Price Analysis: Technical outlook
From a technical standpoint, the GBP/USD is neutral-biased, though tilted to the downside. It remains below the key 200-day moving average (DMA) at 1.2555, which delineates an asset’s bullishness or bearishness. However, buyers are gathering momentum as the Relative Strength Index (RSI) punches above the 50-midline level.
With that context, if buyers achieve a daily close above the 200-DMA, that will expose the 1.2600 figure. Further upside is seen past the 50-DMA at 1.2621, followed by the 100-DMA at 1.2645. Once those levels are surpassed, the 1.2700 mark is up next.
Conversely, failure at the 200-DMA adds pressure on Sterling, which could drag the GBP/USD exchange rate beneath the 1.2500 mark. A breach of the latter will expose the April 24 low at 1.2422, followed by the April 22 low at 1.2299.
GBP/USD Price Action – Daily Chart

GBP/USD
| Overview | |
|---|---|
| Today last price | 1.2532 |
| Today Daily Change | 0.0038 |
| Today Daily Change % | 0.30 |
| Today daily open | 1.2494 |
| Trends | |
|---|---|
| Daily SMA20 | 1.2517 |
| Daily SMA50 | 1.2624 |
| Daily SMA100 | 1.265 |
| Daily SMA200 | 1.2557 |
| Levels | |
|---|---|
| Previous Daily High | 1.2542 |
| Previous Daily Low | 1.2449 |
| Previous Weekly High | 1.2542 |
| Previous Weekly Low | 1.23 |
| Previous Monthly High | 1.2894 |
| Previous Monthly Low | 1.2575 |
| Daily Fibonacci 38.2% | 1.2485 |
| Daily Fibonacci 61.8% | 1.2507 |
| Daily Pivot Point S1 | 1.2448 |
| Daily Pivot Point S2 | 1.2402 |
| Daily Pivot Point S3 | 1.2355 |
| Daily Pivot Point R1 | 1.2541 |
| Daily Pivot Point R2 | 1.2588 |
| Daily Pivot Point R3 | 1.2633 |

