
- GBP/USD could find resistance around the psychological level of 1.2800.
- The momentum indicator MACD suggests a confirmation of a bullish trend for the pair.
- The 21-day EMA at 1.2712 appears as the immediate support, followed by the lower boundary of the rising channel at 1.2700.
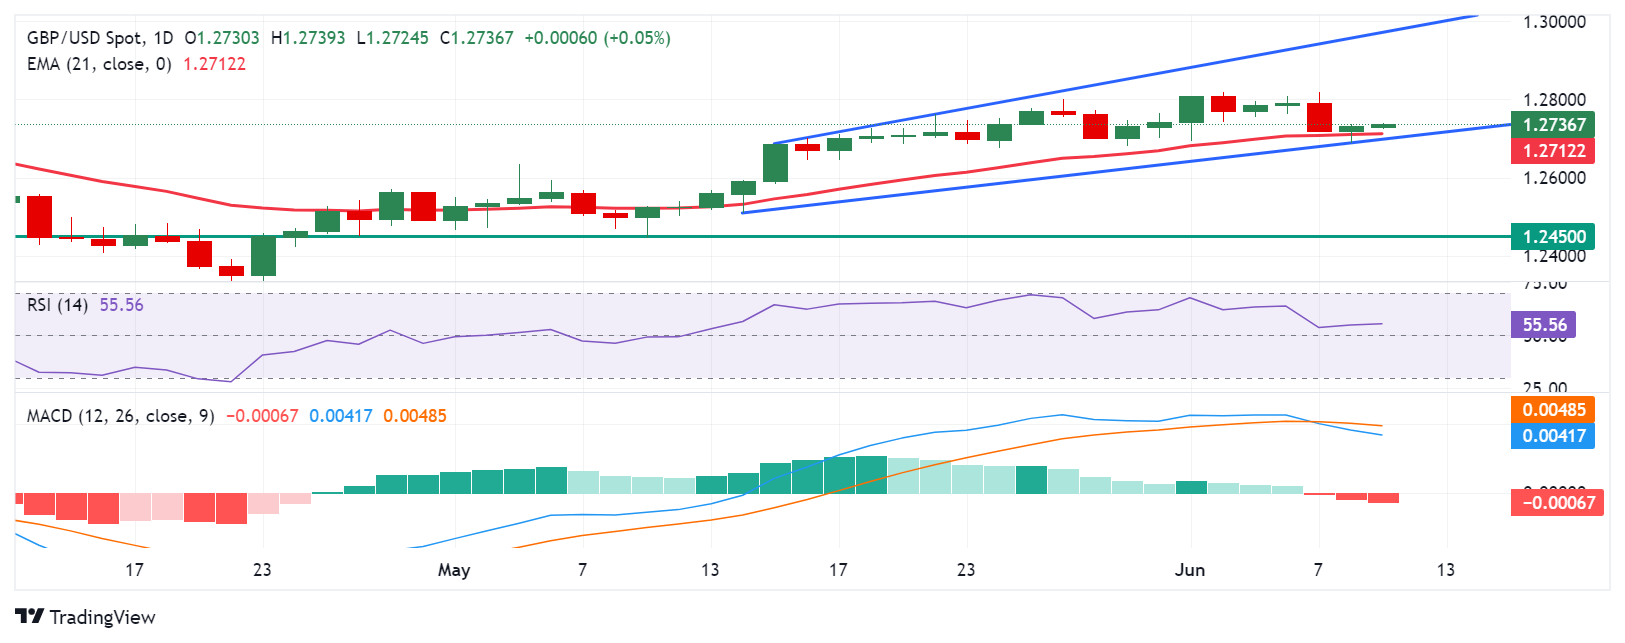
GBP/USD extends its gains for the second successive session ahead of employment data release from the United Kingdom (UK), trading around 1.2740 during the Asian session on Tuesday. The pair consolidates within the rising channel pattern on a daily chart, with the 14-day Relative Strength Index (RSI) positioned above the 50 level. indicating the bullish bias.
Additionally, the momentum indicator Moving Average Convergence Divergence (MACD) suggests a confirmation of the bullish trend as the MACD line is positioned above the centreline and shows divergence above the signal line.
The GBP/USD pair could find the key resistance around the psychological level of 1.2800. A breakthrough above this level could lead the pair to test the upper threshold of the rising channel around the level of 1.2970.
On the downside, the immediate support appears at the 21-day Exponential Moving Average (EMA) at 1.2712, followed by the lower boundary of the rising channel at 1.2700. A break below the latter could exert pressure on the GBP/USD pair to navigate the area around the throwback support at 1.2450.
GBP/USD: Daily Chart
GBP/USD
| Overview | |
|---|---|
| Today last price | 1.2738 |
| Today Daily Change | 0.0007 |
| Today Daily Change % | 0.05 |
| Today daily open | 1.2731 |
| Trends | |
|---|---|
| Daily SMA20 | 1.2726 |
| Daily SMA50 | 1.2603 |
| Daily SMA100 | 1.2638 |
| Daily SMA200 | 1.2546 |
| Levels | |
|---|---|
| Previous Daily High | 1.2737 |
| Previous Daily Low | 1.2688 |
| Previous Weekly High | 1.2818 |
| Previous Weekly Low | 1.2695 |
| Previous Monthly High | 1.2801 |
| Previous Monthly Low | 1.2446 |
| Daily Fibonacci 38.2% | 1.2719 |
| Daily Fibonacci 61.8% | 1.2707 |
| Daily Pivot Point S1 | 1.27 |
| Daily Pivot Point S2 | 1.267 |
| Daily Pivot Point S3 | 1.2651 |
| Daily Pivot Point R1 | 1.2749 |
| Daily Pivot Point R2 | 1.2768 |
| Daily Pivot Point R3 | 1.2798 |