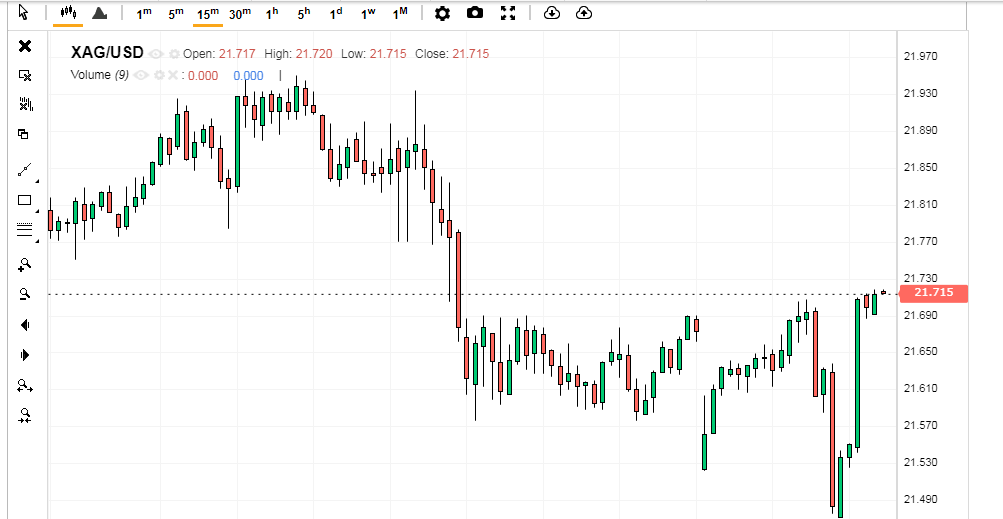
SILVER PRICE ANALYSIS: XAG/USD DROPS TO $21.50 ON ASCENDING TRIANGLE BREAKDOWN
Silver extends Friday’s losses by breaking immediate bullish triangle.
RSI conditions, 100-HMA probe the further downside, weekly horizontal support also challenges bears.
Bulls need a clear break of $22.51 to retake control.
Silver (XAG/USD) remains on the back foot for the second consecutive day, down 0.75% around the intraday low of $21.47, as bears cheer a technical breakout during early Monday. Also keeping sellers hopeful is the broad US dollar strength and the bright metal’s failure to cross the $22.00 hurdle.
SILVER PRICE ANALYSIS: XAG/USD DROPS TO $21.50
However, the nearly oversold RSI conditions and the 100-HMA restrict immediate declines of the XAG/USD to around $21.50. Also acting as a downside filter is the one-week-old horizontal support near $21.35.
Should the quote drop below $21.35, the odds of witnessing a fresh monthly low, currently around $20.90, can’t be ruled out. The same highlights the yearly bottom marked in May, close to $20.45.
Share Market Daily
Meanwhile, the silver buyer’s return needs a clear upside break of the $22.00 hurdle. Though, the 200-HMA level of $21.65 and the aforementioned triangle’s lower line around $21.80 may restrict the immediate recovery of the metal.
In a case where the commodity prices rise beyond $22.00, the $22.30 and a monthly high of $22.51 may rest the XAG/USD bulls before giving them control.